I encountered some issues during the development of TeroBuild/Terobo. This post discusses how I handled those issues.
Terobo is a replacement for a small runtime called Norebo written by Peter De Wachter. Norebo was originally implemented in C, and its purpose is to act as a bridge from a host system (i.e., your computer) into the world that Wirth's Oberon system expects to inhabit, by simulating it. That means simulating the instruction set of the bespoke RISC design that Wirth cooked up, plus a handful of system calls (or "sysreqs") to interact with the outside world on the host machine.
Under Terobo or Norebo, when an Oberon program uses the Files.Seek or
Files.Write APIs within the system, the bridge on the inside of the system
relies on the machine code executing no differently than the CPU embodied in
real world hardware would, up to and including the branch instruction that
jumps from the calling code into subroutine being called. The Norebo bridge
at this point, however, attempts to write to a very large memory address:
something like 0xFFFFFFFC, or -4 if the bit pattern is interpreted as a 32-bit
two's complement signed integer. Since the hardware being emulated has
nowhere near 2^32 (4GiB) of memory, this address space is reserved for
memory-mapped IO, and it's known that this address in particular is used for
making sysreq calls.
Both Terobo and Norebo, simulating the hardware in question, know to intercept
reads and writes in this address space and handle them accordingly. For
example, the runtimes associate a Files.Seek request with the constant 15.
When a machine-level store instruction attempts to write the value 15 to
0xFFFFFFFC, the runtime delegates to an equivalent operation on the side of
the bridge rooted in the host system. Otherwise, Terobo is very much
concerned only with the fetch/decode/execute cycle present in anything dealing
with machine-level instructions. This can pose some problems, especially when
it happens on such an obscure platform.
Terobo is using a special build of the Oberon system crafted specifically to
operate non-interactively, with no peripherals to provide input and output for
the system, making diagnosis difficult when a problem rears its head, given
how opaque this works out to be. Disregarding that, the debugging situation
even within a full-fledged Oberon system is basically non-existent. Despite
the language being an ostensibly "safe" one, Oberon programs—especially the
system-level modules that get much of the CPU time within Terobo and
Norebo—are perfectly capable of and prone to doing the sorts of things
commonly associated with a language like C, such as branching into the void,
otherwise dereferencing a bad pointer, or getting caught in an infinite loop,
all because, say, my Files API implementation for Terobo is buggy.
So aside from writing perfect code on the first pass, how does one deal with this?
For one, Peter's implementation in C already existed, which was helpful as an overall guide, but not in fixing implementation-specific problems in the code I was writing. (Side note: I'm not a fan of the buffer and typed array design that TC-39 came up with for working with binary data. I find it really cumbersome, and it's fraught with gotchas. For all its problems, I think the way C exposes this kind of stuff to the programmer, if you consider language design as a sort of UI, to be better, even with the proliferation of pointers and the perils of using arithmetic for them.)
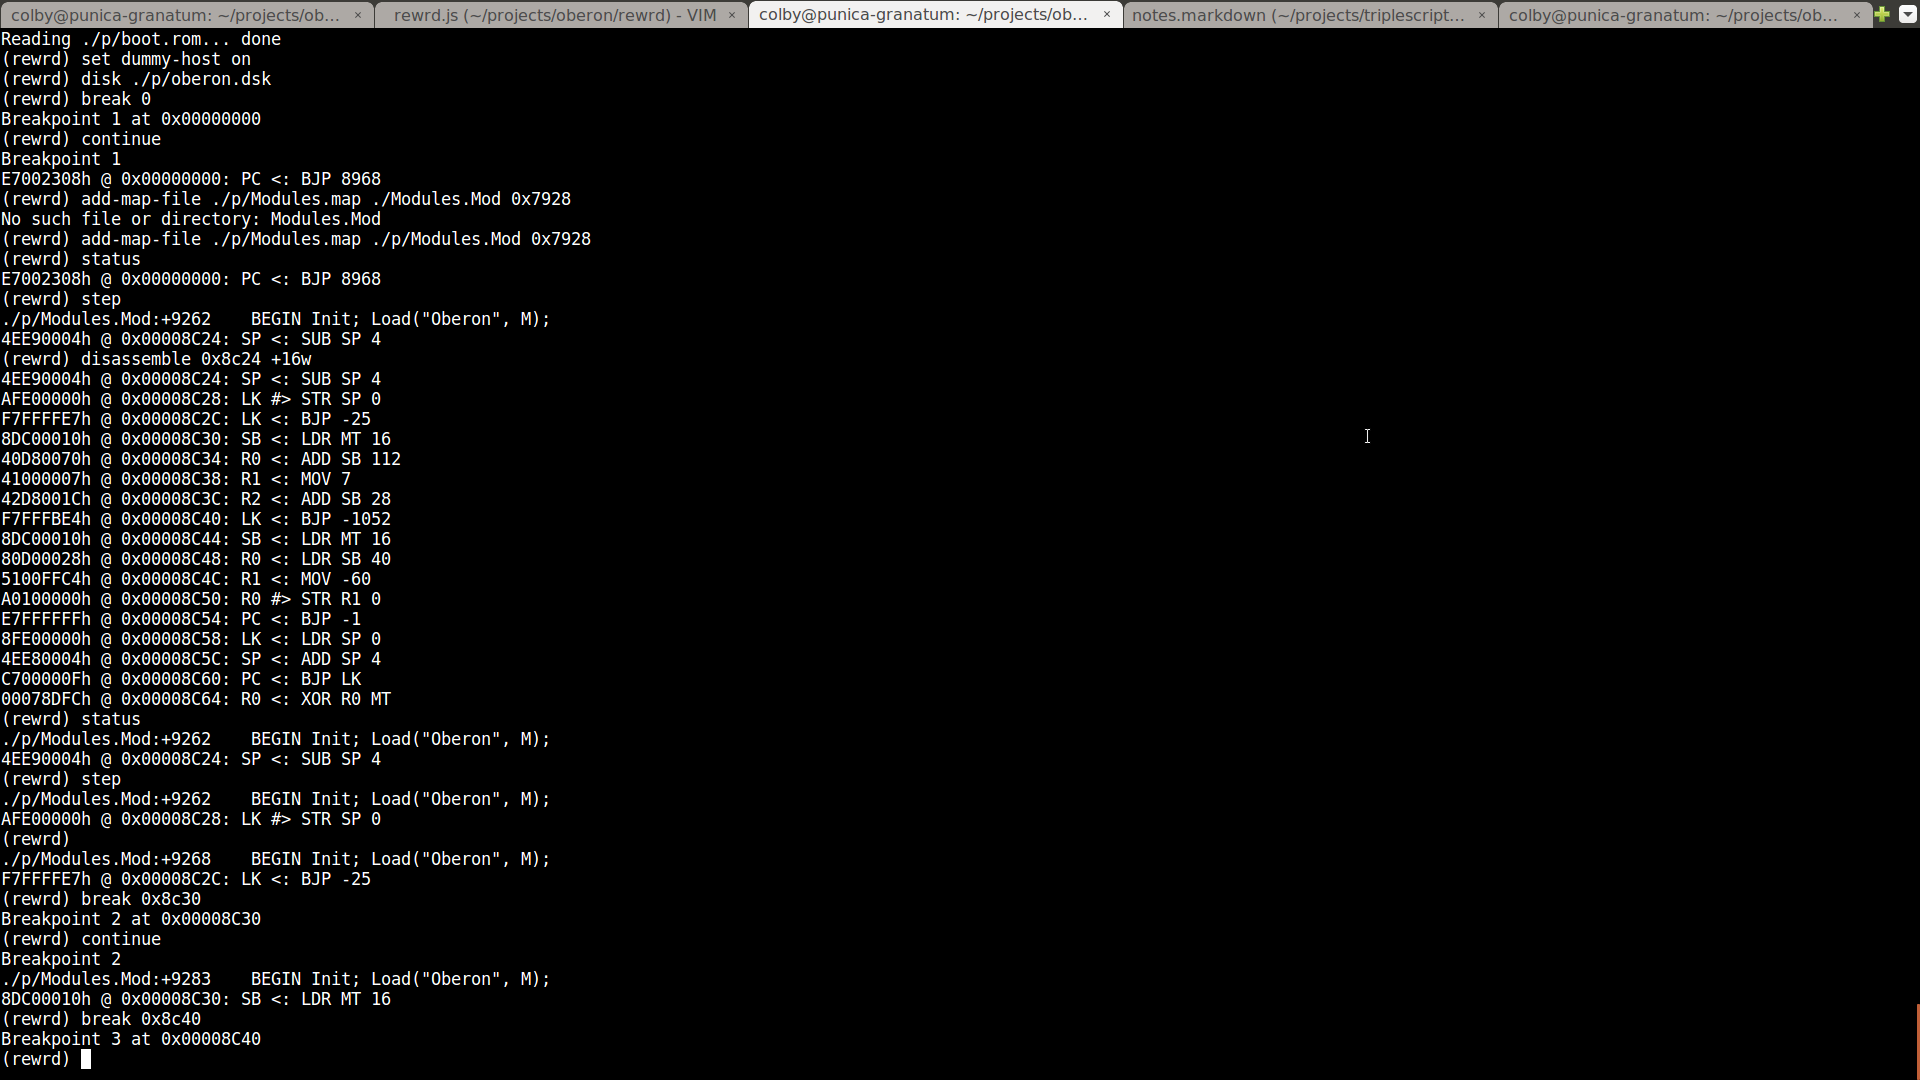
Secondly, I'd already begun working on my own interactive gdb-like debugger to
operate at the machine-level, allowing you to pause execution by setting
breakpoints, peek and poke at memory addresses, disassemble blocks of
instructions, and step through execution. Since the debugger fully controlled
the machine simulation, I'd even implemented reversible debugging so you could
step backwards through code. It's on this basis that I began working on
Terobo. Rather than starting from a blank slate, I just forked my debugger
(called rewrd), and began patching it in the general direction of Norebo,
implementing Peter's design for the special memory mapping scheme I explained
earlier.
Here's a look at rewrd in action:
Occasionally, while developing Terobo, there would be problems that I had no idea how to solve, due to how difficult it was trying to peer into a machine operating so opaquely and where you had no bearings. I did already have support for importing source maps to follow an arbitrary machine instruction back to the original line of Oberon source code that was responsible for the position in the current stack frame, although I didn't have any such maps on hand for the binaries distributed in the Norebo directory. Generating them would have been and still is a fairly cumbersome process, and finding out which blocks of memory they mapped to would be something like an order of magnitude even harder than that. I'd also already added a way to produce something akin to core dumps, but this wasn't particularly useful given the absence of any other tools that could process these dumps and communicate anything meaningful about what they'd contain.
Two things that proved invaluable were adding tracing to both my implementation and the C implementation, and I added memory dumps as well. I patched the C implementation to take command-line flags to enable tracing, limit the number of steps the simulated machine would take before halting, or limit the number of memory-mapped sysreq invocations to handle, and upon reaching the limit, immediately dump the machine's memory to disk, along with the binary log containing the execution trace.
I implemented tracing very simply: every time the machine executed an instruction, it would log the memory address of the instruction in question, along with four bytes containing the instruction itself. Based on this, and the same mechanism implemented in Terobo, I could take these traces, convert them into human readable text files using a pipeline, and then diff them, all with tools from the standard UNIX toolbox.
Here's the magic pipeline I used:
od -v -A n -t x4 .../terobo_trace | sed \
  "s/\([^ ]\+\) \([^ ]\+\) /\1 \2\n /"
I was pretty bummed when I checked the man pages for od and didn't find any
way to force it to output to two columns (for two four-byte fields) instead of
four columns (for 16 bytes per row of output). The sed transformation fixes
this, although it can be somewhat slow for very large trace logs—I didn't feel
like stopping to write the code to do my own text conversion, though, even
though I should have.
Given two textual trace logs, one from my implementation and one from Norebo,
the line offset where diff reported a disparity may or may not be the
offending instruction. It's possible that due to a bad sysreq implementation
of some earlier call, the machine was ending up in a bad state but in such a
way it wasn't apparent by looking solely at the execution trace. So having
narrowed down a place where a problem was known to occur, I then turned to
looking at memory.
If some difference was apparent between Norebo and Terobo's traces at step N, I'd take snapshots of the contents of memory there (only 8MB—up from the 1MB that Oberon ordinarily runs under), and look at how the two compared. I'd then establish the existence of some prior state where the two implementations agreed, and work my way towards the problem area using the familiar process of bisection. It was reasonable, though, to expect in most cases that any given problem that occurred was a result of the implementation for the previous sysreq.
And that's essentially it for half the bugs that I spent my time on.
Of the other half, they turned out being problems either in how I was dealing with asynchronous file reads and attempting to re-enter the fetch/decode/execute loop, or the poor way I'd hacked Terobo on top of rewrd's debugger repl. The debugger ended up being very useful, however.
Even without the class of bugs that wouldn't have occurred had I not decided to start off with rewrd forming the initial basis of the implementation, I'm not sure how much longer development would have taken if I'd not had the interactive debugging shell available. Additionally, I ended up fixing a number bugs and adding features to rewrd as a result of my needs developing Terobo, so there came some other good out of it.
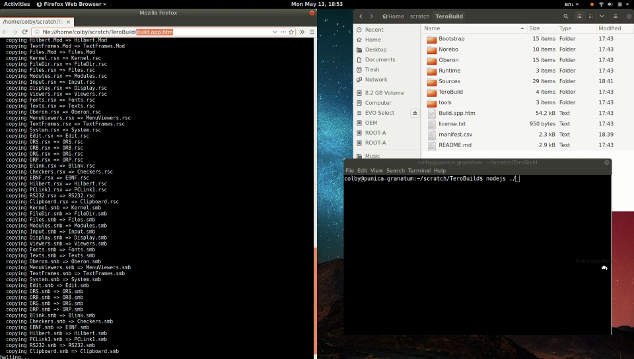
Here, now, is a link (above) to a 2 minute video demonstrating the utility of this work—extremely portable build tooling with no dependencies other than the universally accessible application runtime.